
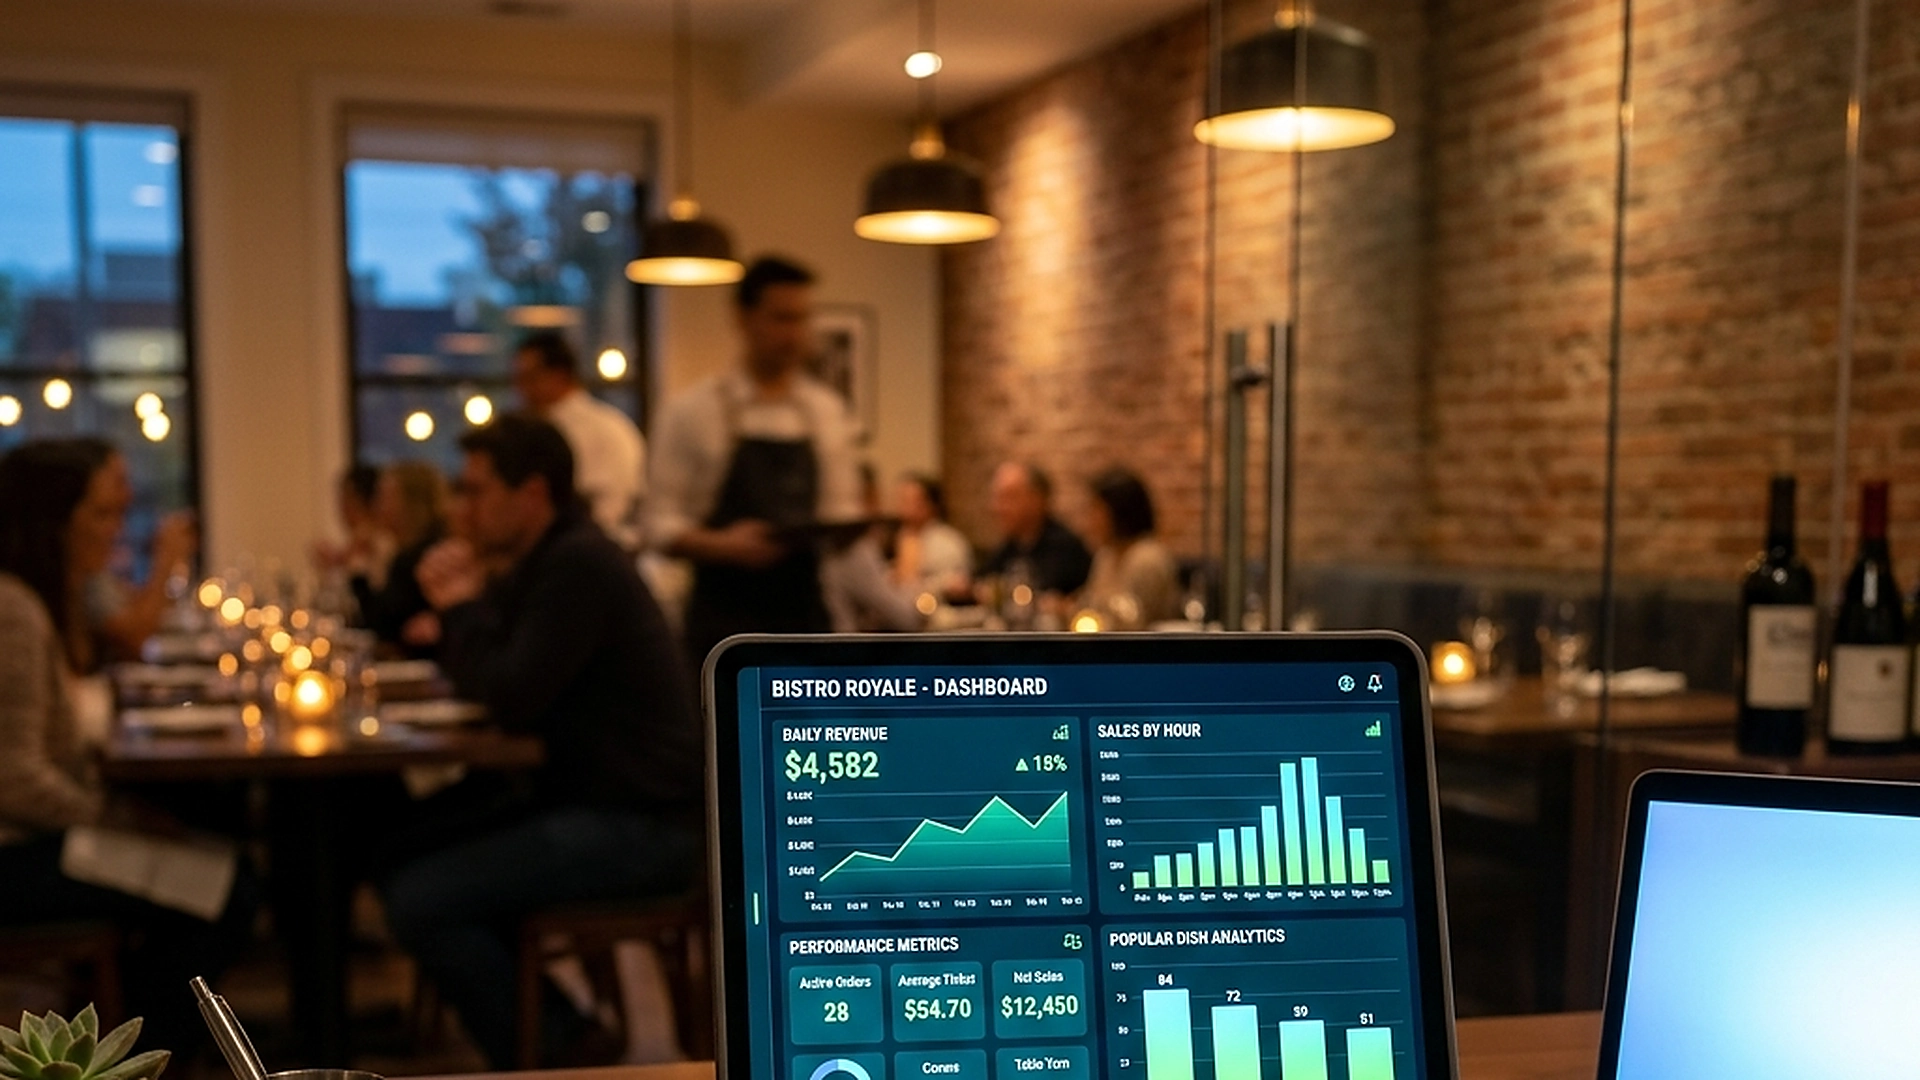
Data is the new salt for restaurant success. Turning simple menu scans and checkouts into structured Business Intelligence (BI) allows operators to engineer high-margin menus, forecast kitchen load, and discover missing demand.
A detailed manual for implementing and utilizing menu analytics, conversion funnel metrics, and predictive heatmaps to optimize restaurant profit margins.
- Track the complete guest journey from landing page view to cart submission.
- Analyze the "Conversion Funnel" to spot high-margin items with low click-through rates.
- Use hourly search term tracking to discover missing guest demand (e.g., gluten-free options).
- Optimize staffing and prep times using peak hour prep heatmaps.
1. The Shift from Basic Sales Data to Menu Analytics
Most point-of-sale (POS) systems can generate a basic report showing what items were sold. While this is helpful for accounting, it does not explain *why* items sold or what sales opportunities were missed. Digital menu analytics provide the deeper context.
By logging every step of the guest journey—including item impressions, modal opens, and cart additions—you can measure the conversion rate of every dish. This data allows you to identify menu layout bottlenecks, test pricing structures, and make informed menu adjustments based on facts rather than intuition.
2. Measuring and Engineering the Menu Conversion Funnel
A menu item's performance can be broken down into a standard funnel: Impression (viewing the card) -> Consideration (opening the detail modal) -> Selection (adding to cart) -> Purchase (order submission). A drop-off at any stage indicates a specific problem.
For example, if a high-margin seafood platter gets many views but zero add-to-carts, the description may be unclear, or the price might be too high. If it gets zero views, it is likely buried at the bottom of the category, needing better placement or a promo banner.
3. Spotting Gaps in Your Inventory with Search Term tracking
Every search query typed into your digital menu is a direct statement of guest intent. By aggregating these search logs hourly, you can discover what your customers want but cannot find.
If the analytics dashboard shows fifty searches for "non-alcoholic gin" or "vegan options" in a month, and you do not offer these items, you have identified a clear, low-risk revenue opportunity to expand your beverage or food list.
4. Utilizing Peak Hour Heatmaps to Optimize Kitchen Efficiency
Kitchen efficiency is determined by preparation speed, not just payment transactions. Standard POS reports record when the bill is settled, which is often hours after the food was prepped. Menu analytics record when the order was placed.
By plotting order submissions onto an hourly heatmap, you can identify the exact minutes when the kitchen experiences the highest volume. Use this data to adjust prep-prep schedules, allocate kitchen staff, and optimize ingredient availability ahead of the rush.
5. Architectural Reliability and System Uptime
Maintaining high availability is fundamental for hospitality applications operating in real time. Redundant server infrastructure and edge replication ensure your digital menu stays active during high-volume dinner rushes without service dropouts.
6. Data Privacy, Encryption, and Security Controls
Protecting customer privacy and venue data is a core operational priority. End-to-end encryption, strict role-based permissions, and cookieless browsing standards safeguard your venue's analytics and guest interactions.
7. Measuring Long-Term Operational Impact
Evaluating long-term metrics enables continuous menu refinement. By tracking guest conversion rates, popular dish views, and average order values, venue managers can make data-driven improvements that boost revenue.
Frequently Asked Questions
Does tracking guest interactions impact page loading performance?
No. Interaction tracking uses lightweight event logging and background beacons, ensuring that guest navigation remains fast and uninterrupted.
Is guest tracking GDPR-compliant?
Yes. The system tracks interactions anonymously using session-based hashes, without collecting personal identifiers or storing permanent cookies on guest devices.
Can we schedule automated reports to be emailed to managers?
Yes. The BI Hub supports automated weekly PDF exports, delivering summarized key performance indicators directly to your inbox.
Final Takeaway
Deciding on menu updates without analytics is like driving in the dark. Utilizing structured data to understand your guests' behavior gives you the insights needed to increase margins, reduce waste, and build a more successful venue.